Porosity Log Overview
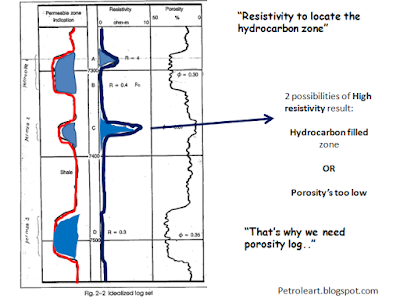
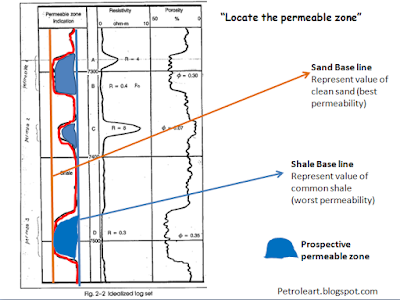
This post is an elaboration of the "Basic Logging Interpretation" slide which I share in my previous post [CLICK HERE ] . This explanation will fit the best if you want to present the " Basic Logging Interpretation" slide at page 7 It is very important to understand that the resistivity log which has high resistivity measurement doesn't always detect the hydrocarbon containing zone. There are two possibilities: first, the low resistivity zone might contain low resistivity fluid, which is hydrocarbon, and if that is the case, we have found our sweet pay zone. But second, the formation might be very small in porosity that the resistivity measurement becomes low. Most of the rock is nonconductive to the electricity, so when the porosity of the rock is very small, there will only small quantity of fluid in the rock. Even when the fluid is very conductive, since the quantity is small, the log will show low resistivity measurement. That is why, the